Detailed and summary versions of the same report
Most finance teams end up producing the same P&L twice. Accounting wants every account visible so variances can be traced and questions answered. Leadership wants one page with a dozen lines and no account codes.
Rebuilding that second version by hand each month — exporting, grouping in Excel, re-checking the totals — is where the time goes, and where errors creep in.
You don’t have to. Consolidate once, then define two mappings over the same ledger. Both read the same transactions, so they cannot disagree; each simply presents them at a different level.
What we’re building
Take a group with five entities. One consolidation, two presentations:
The detail view — for accounting
Income
  Billable Expense Income          12,400
  Design income                     8,200
  Landscaping Services             46,900
  Pest Control Services            11,300
  Sales of Product Income          22,750
  Services                         31,050
Total Income                      132,600
The summary view — for leadership
Revenue
  Service Revenue                  89,250
  Product Revenue                  22,750
  Other Revenue                    20,600
Total Revenue                     132,600
Same 132,600. Same underlying transactions. Six lines became three, in language a board reads without a glossary.
The rule to hold on to: a mapping changes presentation, never arithmetic. Every account still lands somewhere, so Total Income, Gross Profit and Net Income are identical in both. If a summary version disagrees with the detailed one, an account has been left unmapped — not rounded away.
Before you start
You need the consolidation itself working — entities added, accounts mapped, a report you trust. See Regroup Accounts if you are not there yet.
Treat your existing structure as the detail view. It is usually already account-level, which is exactly what accounting wants. So the work below is building the second, summarised mapping — not redoing the first.
Step 1 — Create the second mapping
Open Consolidation, check the Report selector is on Profit & Loss, then open the Mapping dropdown and choose Create new.
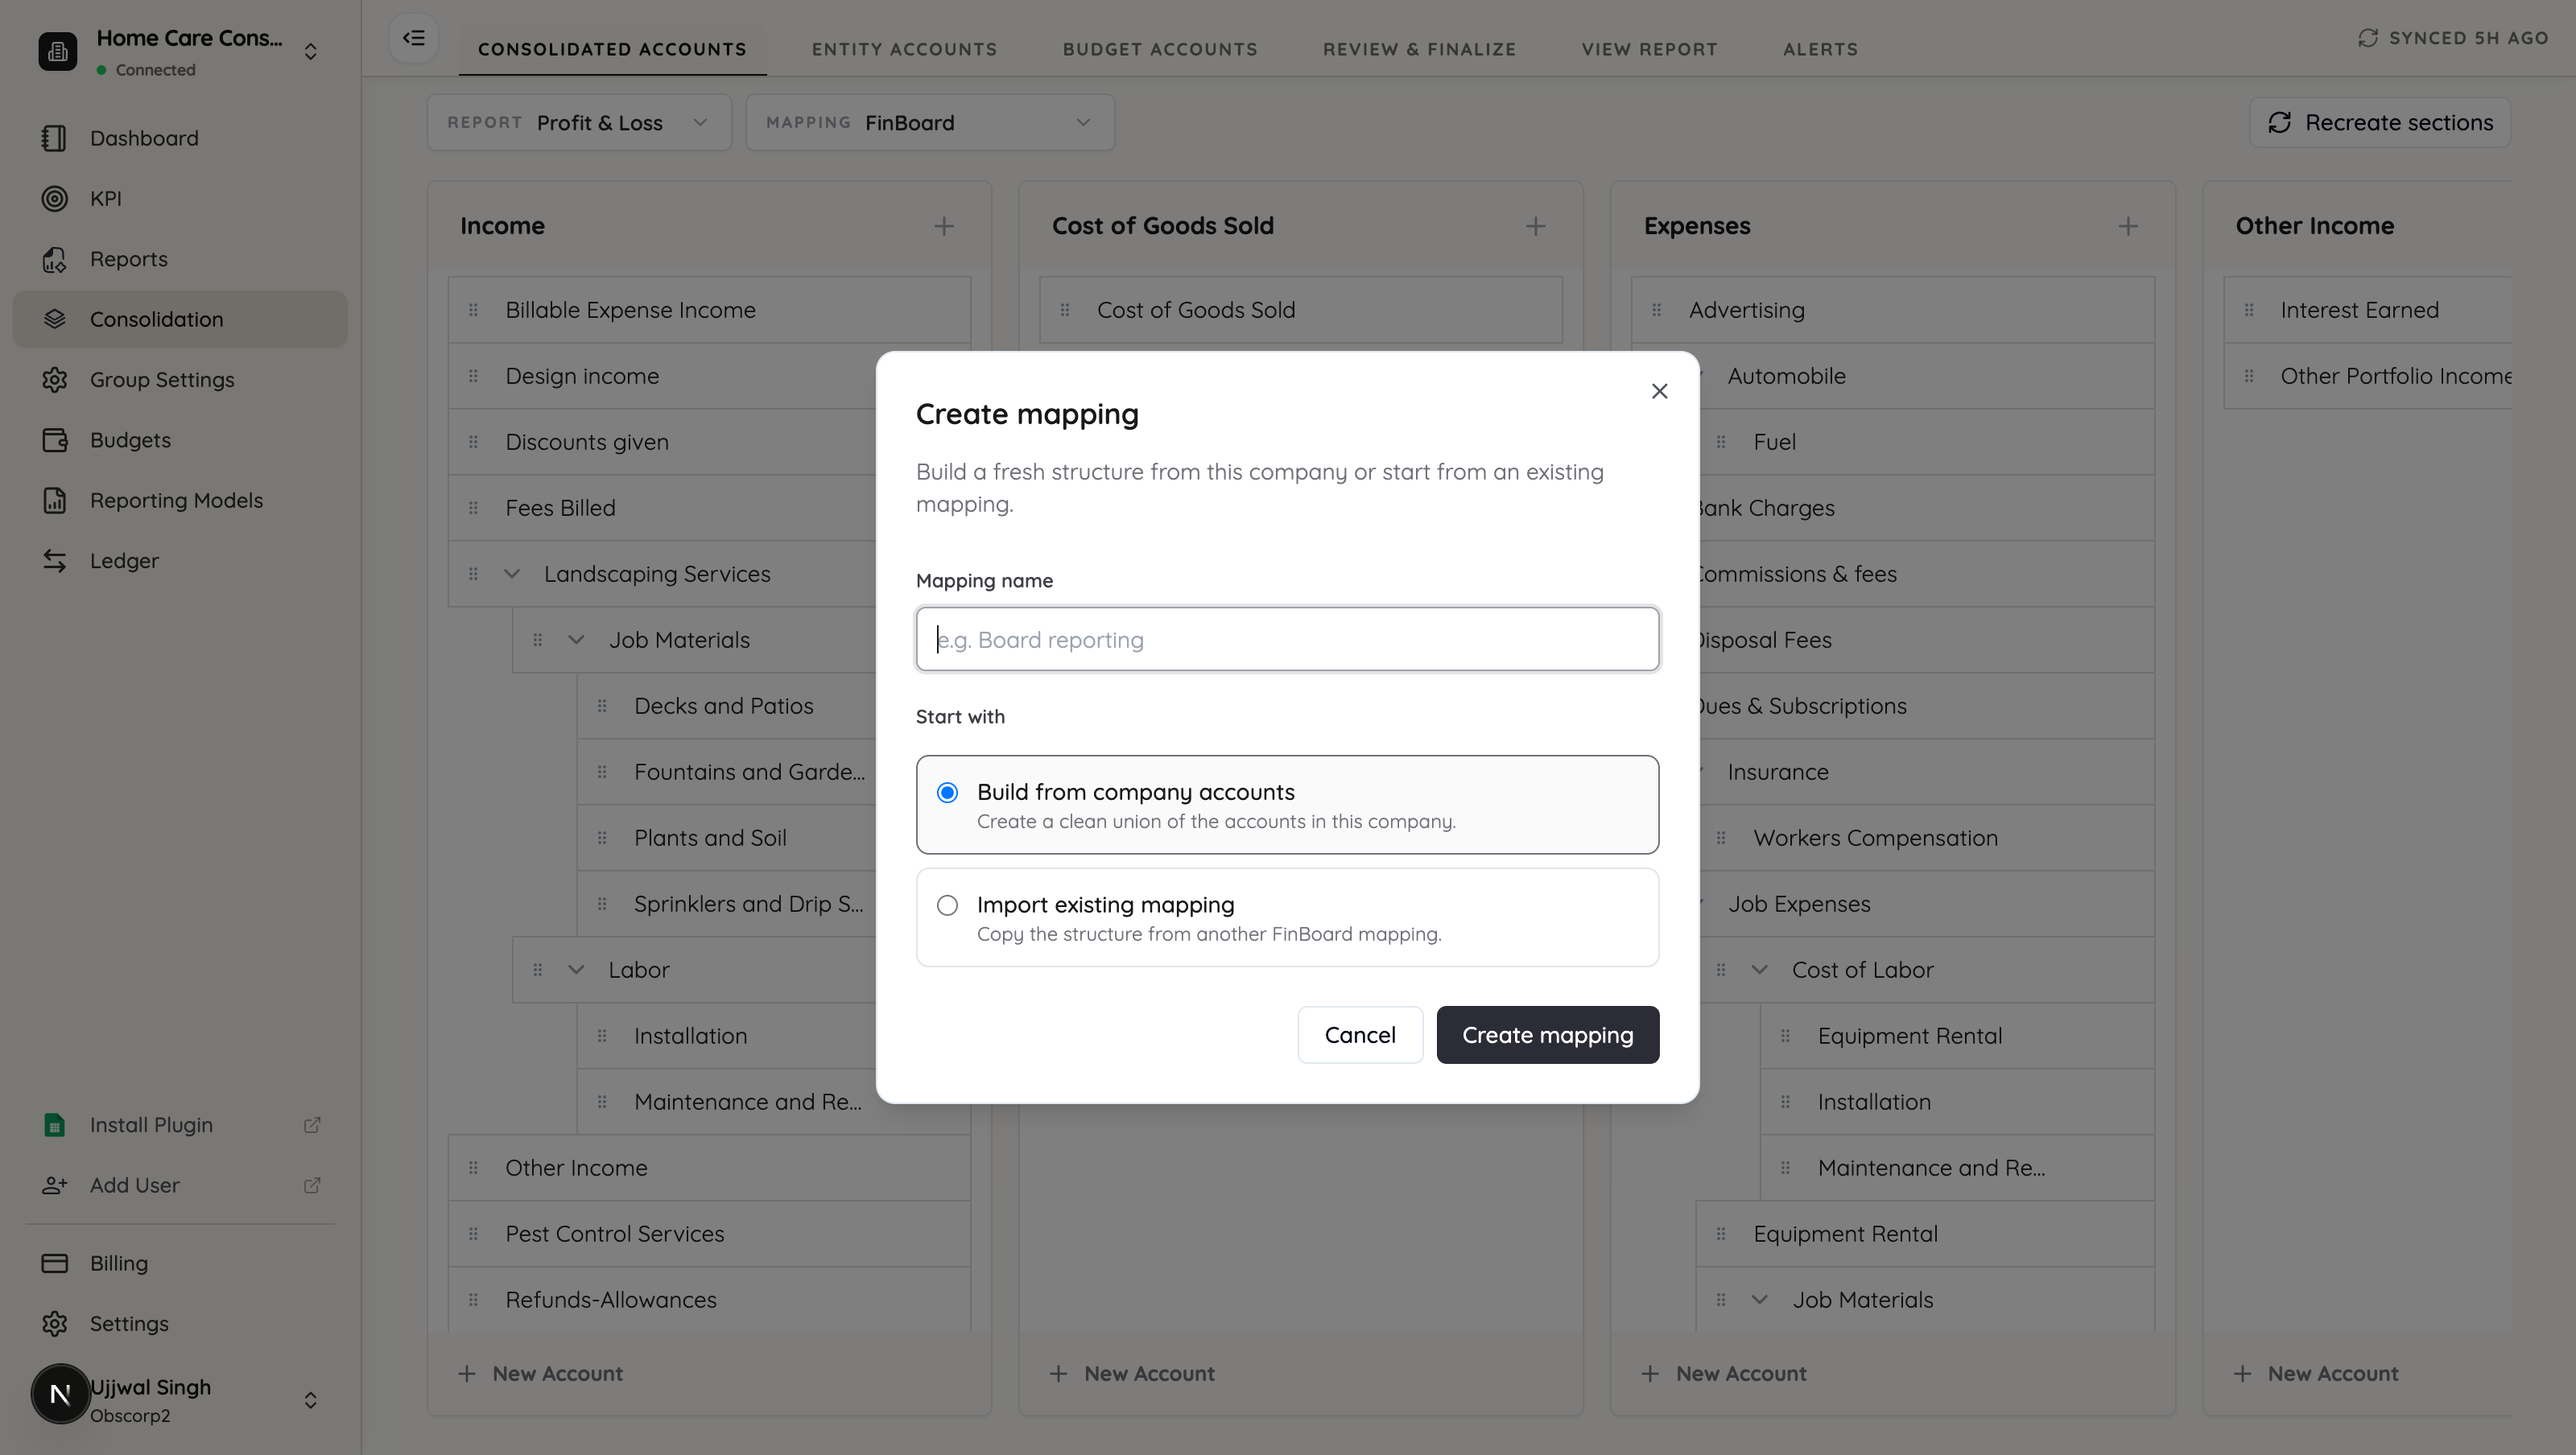
Name it for its audience, not its shape — Board Pack, Leadership Summary, Monthly Flash. Whoever picks it in six months should not have to guess.
Then choose the starting point:
- Import existing mapping — copies your detail structure so you can collapse it down. Usually the faster route: you are merging lines that already exist rather than starting from a blank page.
- Build from company accounts — a clean union of the underlying accounts. Choose this when the summary should be organised on completely different lines from the detail view.
For a summary version, Import existing mapping is normally the right call.
Step 2 — Collapse the structure
You are now editing the new mapping — confirm the Mapping selector shows its name before you change anything.
On Consolidated Accounts, build the handful of lines leadership actually reads. For a P&L that usually means:
| Section | Summary lines |
|---|---|
| Income | Service Revenue, Product Revenue, Other Revenue |
| Cost of Goods Sold | Direct Costs |
| Expenses | People, Facilities, Sales & Marketing, Professional Fees, Other Operating |
| Other Income / Expenses | keep as-is; they are usually small |
Use + to add a group, drag to nest and reorder, and rename freely. Names here are your names — People rather than Payroll Expenses: Salaries & Wages.
Two habits worth keeping:
- Aim for a page. If a section runs past about six lines, it has stopped being a summary.
- Group the way leadership asks questions. They ask “what did we spend on people?”, not “what was account 6100?”. Let the question shape the grouping.
Step 3 — Map every account into the summary lines
Move to Entity Accounts. This is the step that decides whether your two reports agree.
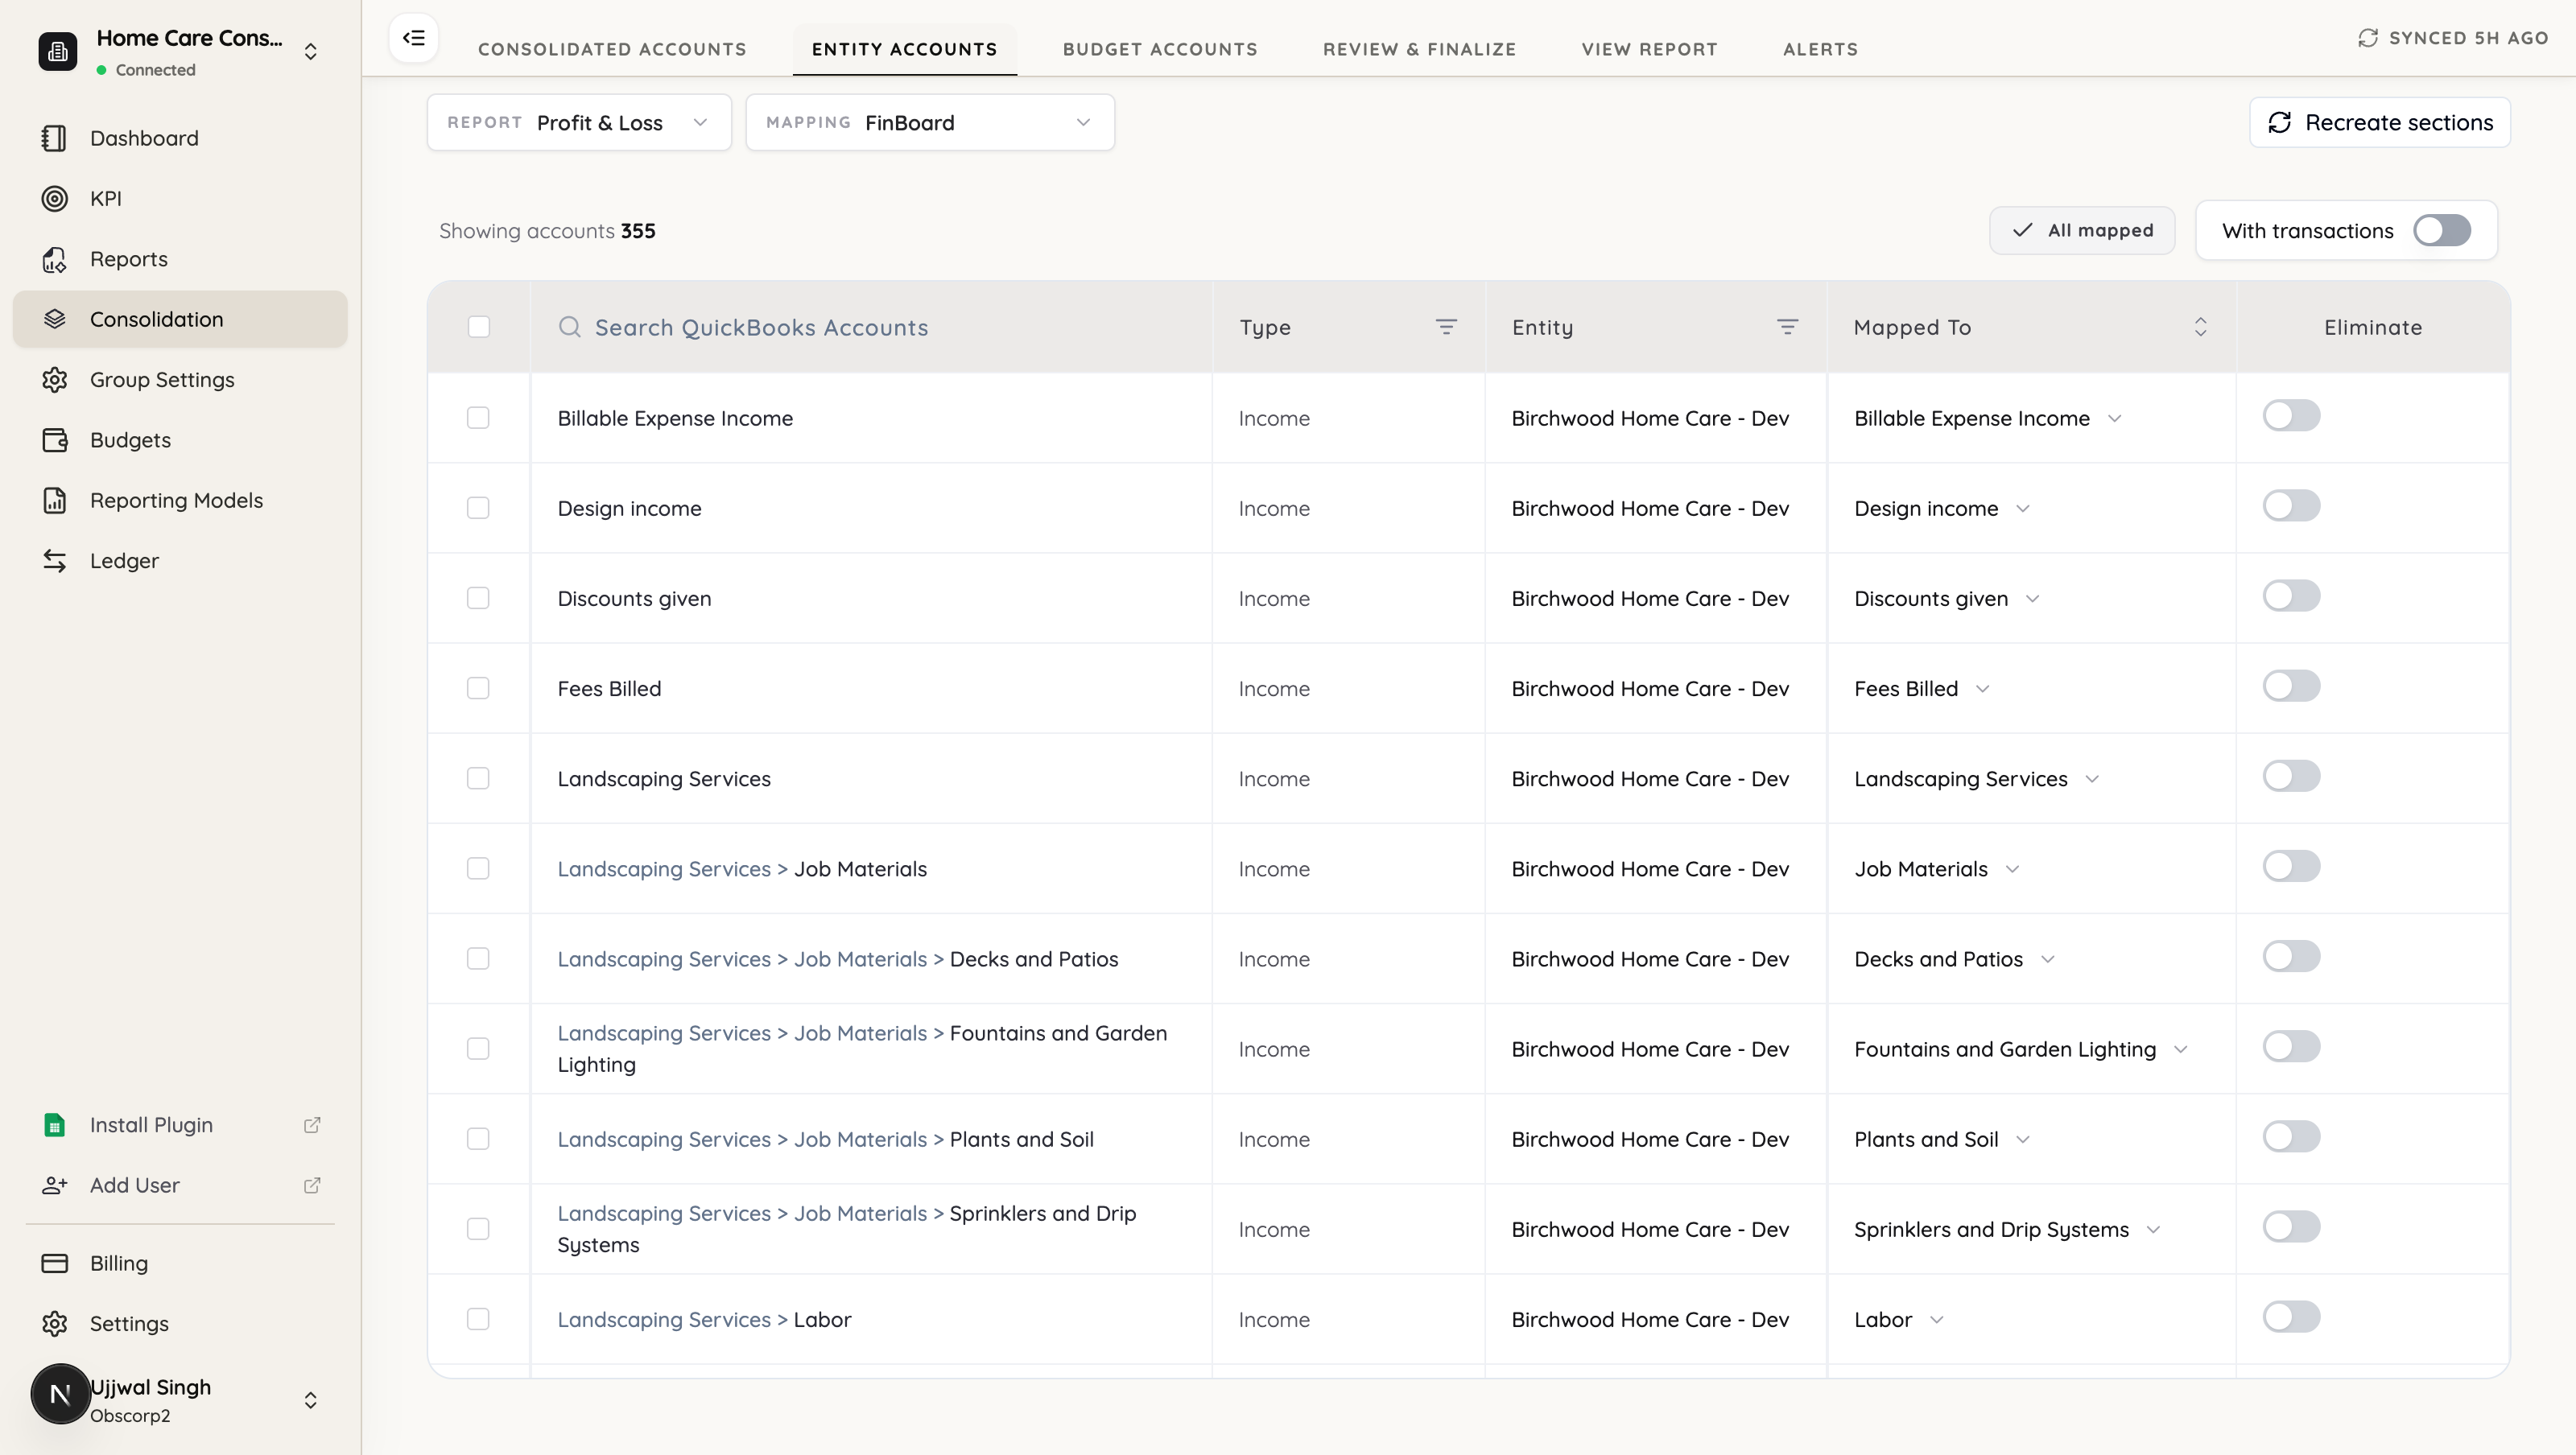
Every account from every entity needs a home in the new structure. Filter by Type and Entity to work through a section at a time, select several accounts with the checkboxes and map them together — that is much faster than one by one, and grouping is exactly what a summary is.
For example, into People: Salaries, Wages, Payroll Taxes, Employee Benefits, Contract Labor.
Then, before moving on:
- Check the All mapped indicator. An unmapped account contributes nothing and silently breaks the tie-out to your detail view.
- Set Eliminate on intercompany accounts, exactly as in your detail mapping. Eliminations are consolidation policy, not presentation, so they must be consistent across both — otherwise the two versions really will disagree, and legitimately so.
Mapping is per-mapping: an account can sit under Salaries and Wages in the detail view and under People in the summary. That is the whole point.
Step 4 — Tie the two out
Open View Report and compare against the same period in your detail mapping. Check, in this order:
- Total Income
- Gross Profit
- Net Income
All three must match to the cent. If they don’t, the cause is almost always one of:
| Symptom | Cause |
|---|---|
| Summary total is lower | An account is unmapped in the new mapping |
| Summary total is higher | Eliminations differ between the two mappings |
| Only one section is off | An account landed in the wrong group — check the boundary between Income and Other Income |
Do this once, properly, on the first month. Once the two tie, they stay tied — later months use the same mapping.
Step 5 — Run each report against its mapping
In the FinBoard plugin, Apply Mapping picks which structure a report is built with.
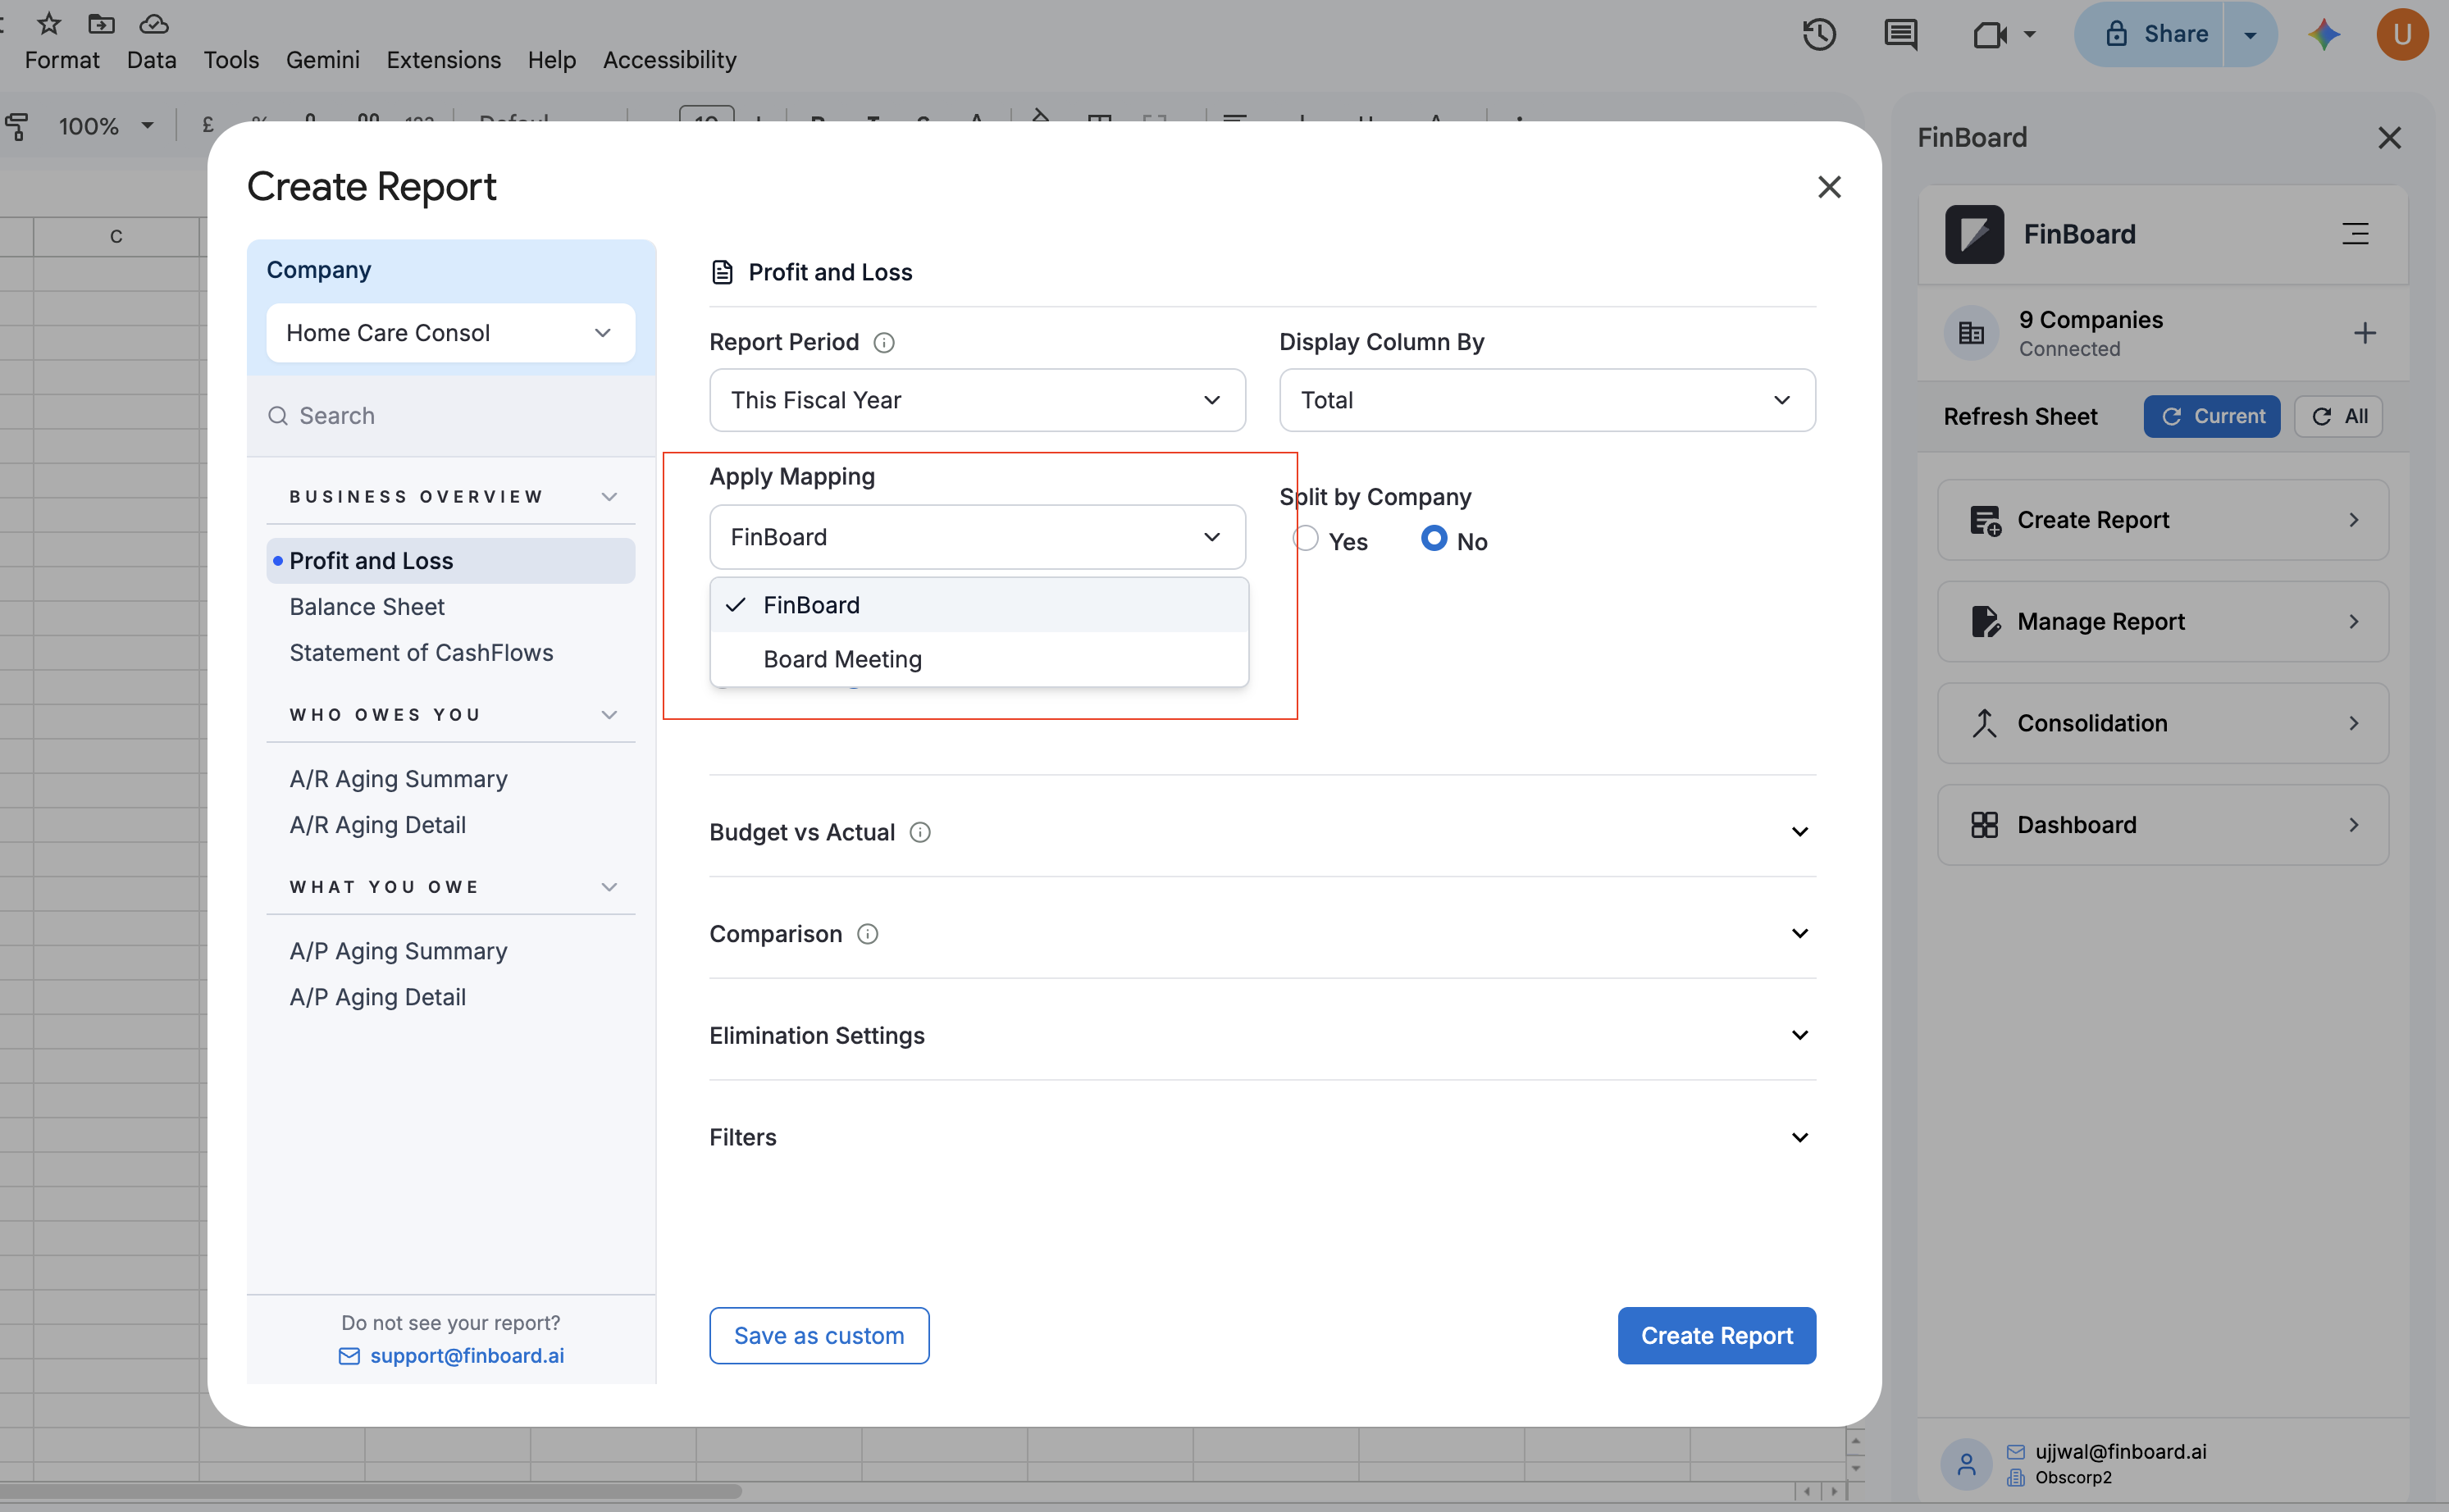
Build the pack twice against the same company and period, changing only the mapping:
- Accounting review → your detail mapping
- Board pack → your summary mapping
Everything else stays identical, so both reconcile to the same ledger. A report keeps the mapping it was created with, so a refresh next month will not silently switch structures.
Keep them in separate tabs or separate sheets and the monthly routine becomes: refresh, glance at the tie-out, send.
Where this goes next
The same pattern extends past two audiences. Teams commonly end up with:
- Detail — accounting review and variance analysis
- Board pack — one page, plain language
- Lender pack — grouped to match covenant definitions
- Departmental — organised to match budget ownership
Each is a mapping over the same consolidation. Adding one never disturbs the others, because they are independent structures over shared data.
When your chart of accounts changes in QuickBooks, remember that each mapping is maintained separately — a new account has to be placed in every mapping that should show it. See When QuickBooks accounts change for handling that without redoing your work.
Related
- Regroup Accounts — building a mapping and its groups
- Apply mapping in reports — choosing a mapping at report time